Disclosure: Privacy Australia is community-supported. We may earn a commission when you buy a VPN through one of our links. Learn more.
Best Stock Analysis Software in Australia (2024: Ultimate Beginner’s Guide)

By
Will Ellis
-

-

-

Last Updated on March 23, 2024
Every trader seeks to discern the prospect of an asset, either in the very short-term, long-term or somewhere in-between.
Stock analysis software helps to “read-the-tea-leaves” by evaluating a specific asset, industry/sector, or even the whole market.
eToro is the worlds largest social investing platform giving you the option to invest in crypto assets, ETFs and stocks all in one place. eToro offers access to 3031 stocks and 264 ETFs.
Whatever the focus, these pieces of software attempt to discern what will come ahead. In this guide, we’re going to cover the best stock analysis software in Australia.
Table of Contents:
- Best Stock Analysis Software in Australia
- What is a stock / stock analysis?
- Factors influencing stock prices
- Stock market explained
- What is stock-market volatility?
- Bull/Bear markets, and short selling
- Fundamental analysis
- Technical analysis
- Technical indicators
- What software do professional traders use?
- What common tools do technical analysts use?
- Where can I analyse stocks for free?
How We Choose our Platforms 📚
In order to provide you with valuable insights and reliable information, we conducted an extensive analysis of the top stock analysis software available in the market. Our rigorous research process involved thorough examination and evaluation based on our specific criteria.
Through this meticulous approach, we ensured that every mention in this guide represents the most widely utilized and trusted stock analysis software globally. Our aim is to equip you with the most reliable tools and resources to facilitate your decision-making process and enable you to read the market trends effectively.
Best Stock Analysis Software Australia – Our Reviews
- ⭐ TradingView – Best cheap fundamentals
- ⭐ StockRover – Best for long stocks
- ⭐ TC2000 – Best professional-on-a-budget
- ⭐ MetaStock – Best industry-leading
- ⭐ TrendSpider – Best Ai-powered charts
In other words, you can use each service for most analytics more-or-less, adjusting for the use-case. So, starting with entry number 1.
1. TradingView Review – Strong fundamentals
The Most-Mentioned Platform in the Stock Analysis World…
Key Features:
- Robust Chart Analysis
- Social Trading: Follows, Chats, Etc.
- Strong Community Support
- Beginner-Friendly
- Strong Backtesting & Screening
Pros
- Global stocks, forex, crypto
- Recommended for screening
- Low latency data
Cons
- No live-news feed
- No stock options trading
📓 Review
TradingView came to greater awareness through social integrations
Both a brokerage and technical analysis service that gives users access to stock markets across the globe… Apart from stocks, get coverage for futures, forex, mutual funds, bonds, crypto, and ETFs — all included as part of a package fee.
The software itself is only PC-compatible: it works on a cloud-powered HTML-5 layer; in other words, there’s no need to install anything — once the software is launched, it automatically connects the various APIs needed for things to work smoothly.
Like most of the other services already mentioned in this guide, trading view lets you fully integrate its charts into your brokerage, so that real-time analysis can be done that automatically factors in profit and loss, reporting, analysis, and so on (except for stock options trading).
Other unmentionables include fundamental (an immense list that includes the World Economic Growth rates) and real-time screening and scanning, watchlists, and an active community that brings together traders.
On the social trading aspect of things are news feeds from social networks; Community-Built analytics, indicators, and fast charts (no extra charge); and live news from the following:
- 📰 Futures Magazine
- 📰 DailyFX
- 📰 Kiplinger
- 📰 StockTwits
- 📰 FXStreet
2. StockRover Review – Great research for stocks
The ‘Warren Buffet’ of the Stock Analysis World 📰
Key Features:
- Superior Fundamental Analysis
- 10 Years of Financial Data
- Unrivalled Screening
- Available for Android, IOS, PC, Mac
- Strongly Suits Long Traders
Pros
- No installation needed
- Superb individual stock reports
- Integrates with almost all every big broker
Cons
- Cannot trade from charts (suits long-term investors)
📓 Use Cases
Sure, it doesn’t support direct trading from its charts. But it handles reporting. Also providing guidance on “big-picture” portfolio adjustments.
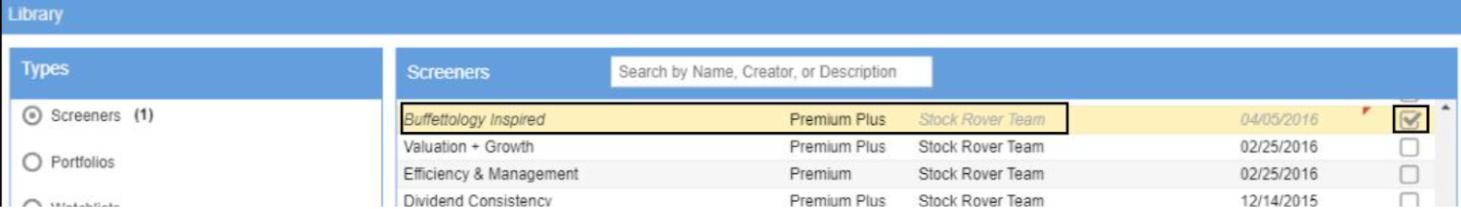
The premium version teleports you to the starting blocks, by offering 150+ screeners (all premade; curated by the StockRover team). Stay updated on long play news, and data needed for hedging or otherwise fine-tuning streams.
Stock news and social media-related information feeds in from Yahoo Finance / Benzinga News. The former focuses on longform posts and trends about stock moves (e.g. whether Netflix is ‘looking more attractive’ or Top Silver Stocks for Q2 2022.)
This isn’t top-of-the-minute stock trading news for live decision-making… But that’s not the intention. It’s for long-term investors who are using deep tools for discerning broader opportunities over time.
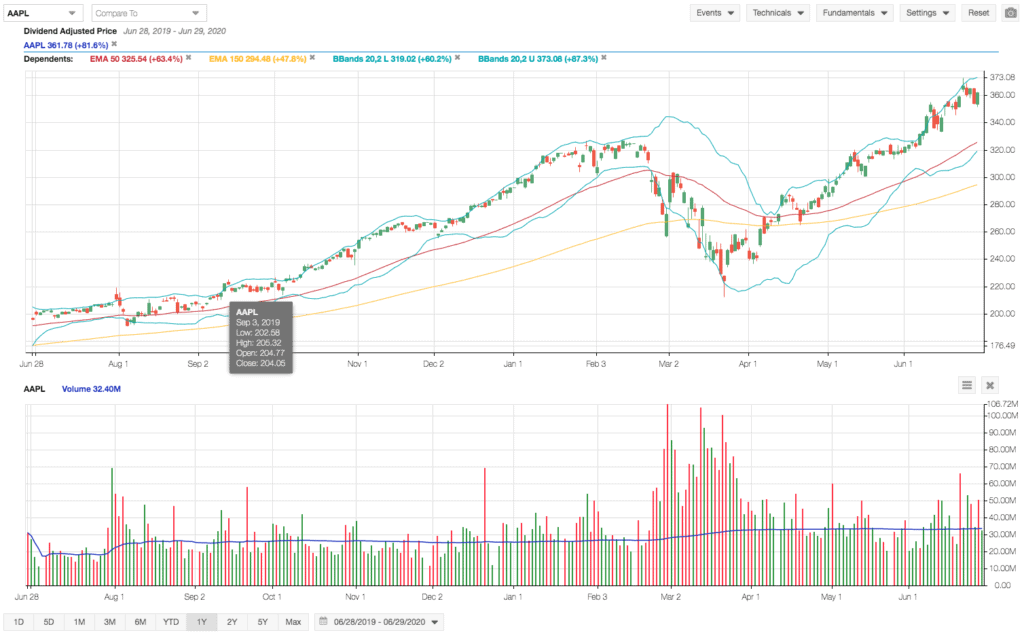
StockRover synchronises with most of the biggest brokers. On the stock chart and technical analysis aspect of things, expect a strong focus on charting fundamental strength indicators for each stock or company. (MetaStock and TradingView use hundreds of indicators for technical analysis. But StockRover will focus-you-in on the foundational pointers alone.)
Scanning capabilities are industry-leading, better than most stock screening out there. The setup is fast; no installation is needed to configure data feeds. In fact, due to its ready-made list of portfolios and screeners, technically StockRover can be used instantly once set up.
Pricing: £22/mo when upgraded to Premium Plus — access stock-filters, scans, watchlists.
3. TC2000 Review – Strongest budget-solution
The ‘eToro’ of the Stock Analysis World
Key Features:
- Budget & Educational Plans
- From-Chart Trading
- Live Exchange Data
- Excellent Margins
- Beginner-Friendly Interface
Pros
- Simulator for beginners / students
- Slick graphics
- Comprehensive charting and scanning
Cons
- Lacks backtesting
📓 Review
Offering a wide range of Consumer-focused services… From private trading to educational trading (High School & University curriculums) — for stocks and funds, TC2000 offers up the following use cases:
- ☑️ News and alerts — Set review chart reminders, indicator notifications, etc.
- ☑️ Personal journal — TC2000’s traders have documented millions of notes. This is a personable way of recalling precise stages of discerning charts and monitoring progress.
- ☑️ Dynamic charting — Simply means a simplified charting interface that is interactive: beautiful graphics, seamless zooming and panning, direct drawing, flexible use of indicators.
- ☑️ Fully functional simulator – For unlimited practice while learning. Professors and students can get an upgraded free program for high schools and universities.
- ☑️ Watchlists — Keep things organised; a place where dozens or hundreds of list entries (sectors, industries, stocks, indices) can be stored and reviewed.
- ☑️ Customisable layouts — Choose from 8 layout templates, which can be further customised into your own personal workspace.
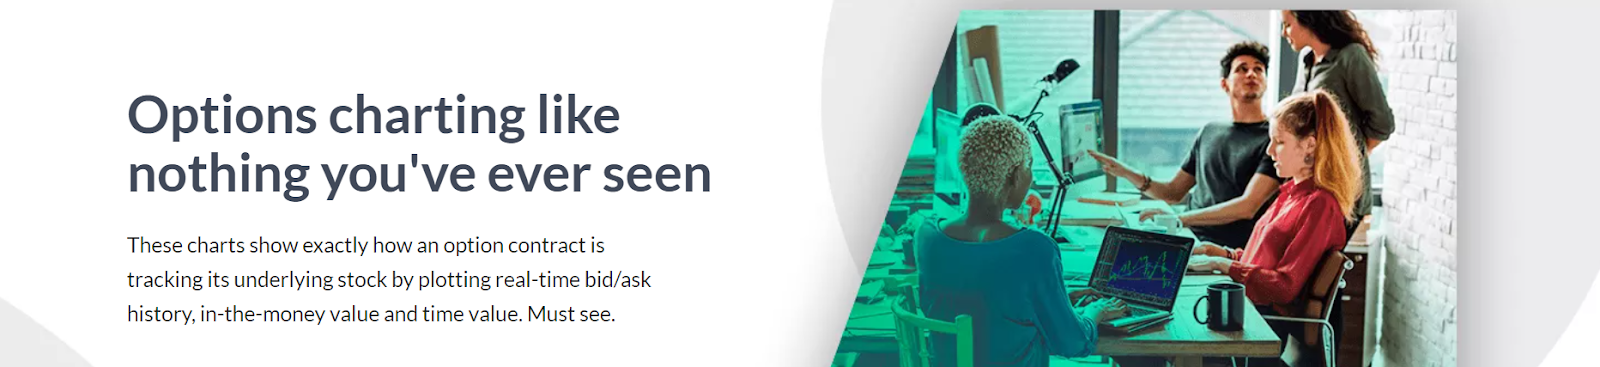
- ☑️ Zones for options profit and loss — Create shaded zones on charts to show where option contracts for courses win or lose and reach maximum risk. This is a proprietary feature that is pending a patent.
There are also built-in options strategies, for instance quickly establishing whether your objective is bearish, bullish, or volatile. With lots of low-latency actions: drawing, technical indicator capabilities, and assets (funds, stocks, ETFs.)
4. MetaStock – Industry-leading capabilities
The ‘Back to the Future’ of Stock Analysis… 🏎️
Key Features:
- Backtesting All The Way to 1980
- Live International News
- Stock Forecasts
- Robust Analytics and Scanning
- Beginner-Friendly Interface
Pros
- Code-customisable
- Reuters news feeds
- Strong trust rating: founded in 1985
Cons
- Slightly premium pricing
📓 MetaStock Review

For fundamental stock analysis; MetaStock implies it by the name. They’ve been a staple in the field of technical, industry-leading stock analysis software for a while, so is a recognisable brand. (Founded in 1985, they’ve held up against the test of time.)
Their stock of products ranges from technical and fundamental analyses — professional level fundamentals, live news feeds from Reuters, and industry-published commentary, data & analytics.
Daily charts are mainly there for after-market reviews, with some real-time trading assistance. For instance, view metrics on the day’s events from various global exchanges. Different add-ons expand capabilities as per need.
There are 300+ technical indicators supporting a large range of assets, which includes mutual funds, derivatives, equities, forex, futures, and ETFs. (Simplify this using filters). And its backtesting — via the Refinitiv DataLink database — incorporates historical data all the way back to 1980…
Note, the software only works with Windows and there’s a learning curve. It suits both long-term and short-term traders.
5. TrendSpider Review – AI-powered charts
🤖 The ‘T-100 Terminator’ of the Stock Analysis World
Key Features:
- Thousands of Automated Trendlines
- Leading-Edge Ai Chart Analysis
- Inbuilt Pattern Recognition
- Candlestick & Fibonacci Recognition
- Forex, ETFs, Crypto, Stocks, Futures
Pros
- Advanced charting strategies
- Beginner-friendly backtesting
- Comparative analysis of timeframes
Cons
- Substantial learning curve
- Lack social trading
📓 Review
TrendSpider is relatively new to the technical analysis arena, but regardless, has excelled at advanced charting using sophisticated algorithms — along with lots of varied asset securities.
There’s backtesting, with automated trend lines, multiple timeframes, and real-time metrics. Overall, execute multistep strategies and get alerted at specific, preconfigured outcome levels. This covers futures, cryptocurrency exchanges, forex, and ETFs — it’s heavily focused on technical market analysis across these assets, at speed, sophistication, and detail.
Possible good addition to supplement a pre-existing analysis software.
Buying Guide
What is a stock / stock analysis? 📚
Stock analysis is evaluating a specific trading instrument, an industry, sector or the full market. Stock analysts seek to figure out the future movements of one or more of these aspects. A person who owns stocks in a company is known as a shareholder.
Shareholders possess a part of a company’s earnings and residual assets (for instance, if the company needs to dissolve). If you own stocks, you’re known as a stockholder or shareholder. But the terms “shares, entity, and “stock” are interchangeable In financial speak.
The stock market is made up of an exchange where traders can offer close positions in individual shares for a firm. And if you are in finance as a career, in some form or another – directly or indirectly – you are involved in the movement of stocks, either as a buyer, issuer, or an adviser. And if you own stocks, this means a few of the following things:
Advantages ✔️

- Equity claim for assets – If you’re a stakeholder, you have a stake in the company’s assets that it has stocks in. But the claim of assets only comes into play if the company faces liquidation. In this instance, all of the firm’s liabilities and products are totalled, and once creditors are reimbursed, shareholders can claim what remains. Because critters get paid first before equity orders, stocks are considered higher risk than debt (loans, bonds, and credit). In the end, the equity holder might get nothing.
- Voting – In the event of management issues or changes, shareholders have voting privileges. For instance, a companies’ executive board will meet annually to discuss performance. They go over future plans and management changes. But if stockholders and investors disagree with current or new plans, they can negotiate for a change in direction.
- Capital gains and dividends – A company can pay out earnings to stockholders in the form of evidence (for instance, yearly or quarterly), or it can capture all earnings in order to further grow the business. But besides dividends, stockholders also gain from capital gains when stock prices rise.
- Less liability – Shareholders own part of the company to a limited degree. So if the company goes bust, they won’t be personally held liable.
Disadvantages ✖️
- Capital loss – This is the fundamental risk involved in speculating on the market by purchasing stocks in a company. It’s not guaranteed that a stock’s value will rise. A trader may purchase shares at A$60 during an IPO, but later find shares depreciate to A$30 when the company starts to perform poorly, for instance.
- Liquidation hierarchy – As mentioned above, during the company’s liquidation creditors get paid before equity holders. And because firms normally only liquidate when very few resources remain for operation, this typically means there are no assets remaining for equity holders after creditors are reimbursed.
- Negligible real voting effects – Technically, executive board meetings factor retail investors opinions, but this practice normally has very little influence. However, the majority shareholder usually has the most influence during shareholder meetings.
Factors influencing stock prices
Many things influence share prices. These range from the global economy, to unexpected events and natural disasters, regulations, shareholder sentiment (i.e. or more precisely, how investors value the company’s future potential) – all of this plays a significant role in establishing the price.
Overall, if the bulk of investors are confident in a company and its future growth and therefore anticipate a large ROI, then the firm’s stock prices will be inflated above its actual value. The two most commonly factored in financial ratios used for rooting stock evaluations in the ground-level consumer or B2B reality are:
- 📉 Earnings growth
- 📈 Revenue growth
Earnings encapsulate how optimally a company is taking care of its resources and operations, in order to reliably create profits. Whereas revenue growth gives the broadest story for analysts, on a company’s services, products, and sales figures – in order to know whether or not it is popular with its customers.
Both of these are top-level indicators that say whether or not shares purchasing shares is a good idea. But, stock analysts dig deeper into further financial ratios and tools, in order to determine whether or not to become involved with stocks in some way or the other.
Stock market explained 📗
The stock market is a place where investors can connect in order to trade and investments – most commonly stocks, which are small pieces of a company. The term “stock market “is frequently used to refer to one of the major stock market indexes, such as the Standard & Poor’s (S&P) 500 or the Dow Jones Industrial Average.
So when you buy stock, you’re usually purchasing online through the stock market, which is open to anybody who has a brokerage account, employee retirement plan, or robo-adviser. Since the early 2000s, it has been increasingly easier for nonprofessional investors to participate in the stock market online.
The stock market is regulated by the SEC; U.S. Securities and Exchange Commission. They’re responsible for managing the orderliness and fairness of these markets, among other things. Whenever you hear a news headline describing how the stock market has moved up or down, this actually means its indexes have changed in value, meaning appreciated or depreciated in sum. This change in price is how investors or speculators make money.
Stock market indexes are used to help track the overall health or performance of the stock market. Each index is a basket of stocks that together should give a picture of how stocks are doing overall. Stock market indexes can themselves be traded as futures or options contracts, and are themselves also traded on exchanges.
As mentioned earlier, the Dow Jones industrial average (DJIA) is one of the major stock market indexes, but others include:
☑️ The Financial Times Stock Exchange 100 Index (FTSE 100)
☑️ The Standard & Poor’s 500 Index (S&P 500)
☑️ The Nikkei 225 Index
☑️ The NASDAQ Composite Index
☑️ The Hang Seng Index
What is stock-market volatility?

There is always a risk involved in investing in the stock market, as it is based on speculation. Investment strategies are designed to make long-term losses less likely and profits more likely. But some strategies are more innately higher-risk than others.
For instance, day trading involves rapid buying and selling of stocks based on price swings. In the short term, it is riskier (although, long-term, there are no overnight fees). On the other hand, position trading – which is investing in the stock market over the long term – can be a lower-risk way of growing wealth over time.
As one example, the S&P 500 has historically averaged an annual return, in sum, of around 10% before adjusting for inflation. But take any single year, and the market infrequently provides that return annually. Some years, the stock market could end in a slump, others in an upswing. These swings are the result of market volatility, which are times when stock values grow or drop suddenly.
Bull/Bear markets, and short selling 🐂
Two staple concepts for stock market analysis are “bear” and “bull” markets. A bear market is when stock prices are overall depreciating. Whereas a bull market is when the stock market is generally rising in the value of its stocks. This is the kind of market most investors thrive in, as most stock investors are buyers, rather than stock short-sellers.
It’s possible to profit in bull markets by using short-selling vehicles. Short selling involves buying a stock that isn’t owned by the purchaser – but is instead bought from a brokerage firm that does indeed own shares of that stock. The borrower then sells off the borrowed stock shares in a secondary market, for profits from the sale of the stock.
Profits are made if the stock price declines in price because the investor can sell at a lower price (counterintuitively, they purchase a sufficient number of shares to reimburse the first broker, in terms of volume, but these shares in total add up to costing less than what they initially bought from the first brokerage firm).
Fundamental analysis
You can roughly batch analysis into two different types:
- 📊 technical
- 🌎 fundamental
Fundamental analysis focuses on data from key sources, such as economic reports, assets, financial performance, and market share. In order to assess a company fundamentally, analysts and investors need to see lots of metrics to do with the company from their financial statements – cash flow statement, balance sheet, and footnotes. The statements are released publicly through the database system Edgar, which is overseen by the SEC. (Another key data source is press releases of quarterly earnings.)
Early reports are a prerequisite of exchange regulatory bodies. Reports are issued annually and quarterly and are closely monitored by market analysts in order to indicate the firm’s performance. One of the most important aspects of the earnings report is the company’s earnings per share (EPS), which is the ratio of the firm’s profits divided by outstanding shares of stock.
The process of fundamental analysis searches-out things like potential growth, solvency, liquidity, operational efficiency, and more. Discovered ratios indicate a company’s health. These ratios vary, for instance, the quick and current ratios observe a firm’s ability to pay short-term liabilities with current assets. Whereas the balance sheet signals how much debt a company has taken on – the higher the debt compared to assets, the higher the leverage is.
In each case, ratios are determined by different specific calculations. For instance, debt ratios are determined by dividing liabilities by assets. But another important variable, in fundamental analysis, is a stock’s market capitalisation – often shortened to market cap.
The “market cap” is the sum value of all remaining shares of the stock. The higher the market capitalisation, normally the more financially stable and well-established a firm is (“blue chips” represent the highest end of this – these companies with long and proven track records are even able to weather economic storms).
Top fundamental analysis ratios:
☑️ Debt-to-equity ratio: A key metric, covering a company’s financial health in terms of integrity. Peer into what proportion of the company’s day-to-day operations are reliant on debt resources, as compared to resources that directly come from equity investors. The lower the debt-to-equity ratio, the more preferable from an investor’s standpoint.
☑️ Price-to-earnings (P/E/) ratio: This is the balance of the company’s stock price proportionately to its EPS (earnings per share; mentioned above). The higher the P/E ratio, this indicates the more that investors will pay per share for the firm’s stocks because they anticipate growth of the company and therefore stock value rises.
☑️ Return on equity (ROE) ratio: The return on equity or ROE ratio is used to gauge a firm’s potential for growth because it proportions the income compared to the net equity that has been invested into the company.
☑️ Profit margin: This is actually composed of several different margin ratios, each of which investors may contemplate – such as the net profit margin and the operating profit margin. Using profit margins gives you an extra layer of insight into companies profitability. Instead of just using the absolute profit amount, profit margins indicate the degree of profitability percentage-wise. For instance, a company may have profited $3 million, but if there only converts to a 2% profit margin, then a substantial slump in revenue may weaken the company’s profitability.
A few last often used financial ratios include the inventory turnover ratio, dividend yields, return on assets (ROA), current ratios, and the price to book (P/B) ratio.
Technical analysis

This method of stock analysis concentrates on the movement of price points, in the present and past, in order to predict future trajectories. Technical analysts are mostly focused on volume and price, but also supply and demand elements. The financial market is analysed. Charts are central to technical analysts, used as a graphical representation of a stock’s pattern in a given time period.
One example of this is a technical analyst noting chart areas where there is a resistance or support level. Resistance levels visually mark off where the market has been at a high previously, compared to the current market value of the stock. Whereas the support level shows where the market was at a previous low. A trend underneath the support level could suggest a bearish movement, to the stock analyst. Whereas a movement over the resistance level would be a bullish break.
To the technical stock analysis, these patterns are only effective when they can be associated with direct supply and demand forces that are motivating the value trend. So – unlike fundamental analysis – if external events are motivating the price trend, technical analysis of stocks might not be useful.
Examples of external elements, i.e. factors other than supply and demand, that can impact the stock’s value include mergers, class action lawsuits, stock splits, dividends, changes in management (such as a deceased CEO), fraud, and scandals, large-scale policy changes, etc.
A few common tools of the trade for technical analysts:
☑️ Overlays – These technical indicators are synchronised to the scale of the stock chart, and added over it. Two examples are Fibonacci lines and moving averages.
☑️ Oscillators – The type of technical indicators not overlaid on price charts; instead, these indicators vary between our local maximum and minimum and are plotted below or over the chart.
Technical indicators
Let’s jump into specific technical indicators. Traders commonly use a variety of technical intake indicators, in order to profile security. As many different options exist, traders select indicators that best suit their style and then learn the ins and outs of that tool.
OBV: On-balance volume ⚙️
The OBV measures the direction-change in the volume of a security. This indicator gives a running total of volume increase against volume decrease. This total is given over a period of time. For instance, one day of up volume is a day when the price has risen. Whereas down volume is a day when the price has fallen. Totals for each day are taken away from each other to indicate the flow of buyers and sellers, volume-wise.
Divergence occurs when the price and indicator move in opposite directions. If the value rallies but the OBV drops, this could mean a trend that isn’t grounded in strong buyer supply – which means it could quickly reverse.
Distribution/accumulation line ⚙️
A frequently used indicator that indicates the flow of money to-and-fro of the security. The A/D line had a similar function to the OBV. Rather than only factoring in the end price of the security for a period, it also factors in the range of trading across that period – and illustrates the closing price relative to that range.
For instance, if a stock finishes at the close of the day near its high for that day, more weight is given to that volume compared to if it was to close nearer the range midpoint. There are some instances where the A/D is more useful, and others where OBV provides greater insight.
But if the indicator line is moving up, this demonstrates more buyer interest – which would be called an uptrend. The opposite would be a downtrend. In terms of diversions, if the A/D line drops (meaning less buyer interest) while costs rise, this could mean a reversal (lower prices) to come.
Average directional index ⚙️
The ADX trend indicator shows the force of a trend. If the ADX rises to more than 40, a trend (not just price) is thought to have more meaning, whether it is downwards or upwards, but this will differ depending on what direction a price is going. When the ADX is below 20, a trend is thought of as weak.
There are three lines on this tool. The main blackline is the ADX. The other two lines are the DI+ and DI-, which are red and green. Together, these lines indicate the momentum and direction of a trend.
Other indicators to be aware of:
- Aroon indicator or aroon oscillator
- Moving average convergence divergence (MACD)
- Relative strength index (RSI)
- Stochastic Oscillator
FAQs ➡️
What software do professional traders use?
Retail traders differ from truly professional traders – the latter, who generally trade full-time. They use high-end software and focus on trimming down latency to the millisecond, there are hefty associated price tags (Level ATS is one example). You will need to be qualified in order to use these platforms skilfully as they are very complicated with multifactor and special order types that go through multiple routing routines.
But two to mention are Trade Station and LightSpeed.
What common tools do technical analysts use?
- ☑️ On-Balance Volume indicator (OBV) – see meaningful changes in volume based on closing prices.
- ☑️ Accumulation/Distribution line (A/D line) – similar to OBV but shows more the supply and demand throughout the day.
- ☑️ Average Directional Index (ADX) – measures the momentum and strength of a trend; by trading with a trend, there is less risk and greater profit potential.
- ☑️ Aroon – measures the trend level of security; also indicating whether a trend will probably change in direction.
- ☑️ Moving Average Convergence Divergence (MACD) – another trend-oriented indicator, with momentum functions, that shows two moving averages of a security’s price relative to one another.
- ☑️ Relative Strength Index (RSI) – measures the size of real-time price changes in order to predict whether it is at under or over its true value. Developed by Welles Wilder.
- ☑️ Parabolic SAR – very useful indicator for showing securities price direction and whether it is changing.; Also known as the “stop and reverse system”. Also developed by Welles Wilder.
- ☑️ Stochastic Oscillator – developed by George Lane; this indicator measures past to price ranges as compared to the current price; normally using 14 periods.
- ☑️ Fibonacci Retracement – for marking out areas of assistance or support; horizontal lines show where they are at core Fibonacci ranges.
Where can I analyse stocks for free?
A few of the top free best stock analysis software tools out there are:
📰 Seeking Alpha
📰 Stock Rover
📰 StockCharts.com
📰 TradingView
📰 TC2000
📰 CNN Money
📰 Finviz
📰 Yahoo Finance
You Might Also Like:
- How to Invest in US Stocks from Australia (2024 Guide)
- Cheap Stock Brokers in Australia (2024)
- Best ASX Penny Stocks in Australia (2024)
- Best Stock Trading Apps in Australia