Disclosure: Privacy Australia is community-supported. We may earn a commission when you buy a VPN through one of our links. Learn more.
Decoding Candlestick Patterns: A Trader’s Guide to Pattern Mastery

By
Will Ellis
-

-

-

Last Updated on August 20, 2024
Edited by
Adam Turner
-
-
-
Fact checked and reviewed
No matter what type of trading you’re interested in, you need to know a few strategies. If you just jump in with nothing in your armoury, you’re swimming in mud. Whether it’s tech stocks, ETFs, cryptocurrency, reading the market is a key skill to develop. No, you don’t need a crystal ball, but what you do need are candlestick patterns.
Yes, it sounds odd, but bear with us.
Reading the market isn’t only about knowing the value of stocks, you need to understand the patterns, direction, and themes. The more information you have, the more likely you are to be successful. That way, you can react when the market moves, and look to profit from it.
So, back to candlestick patterns.
Trading candlestick patterns have guided traders for many years. In fact, studies have shown that 73% of traders use them. At Privacy Australia, a great place to learn more is our Forex.com platform review. There you’ll be able to learn how candlestick patterns work in practice. But for now, let’s delve even deeper.
TL;DR
- Candlestick charts offer visual insights into price movements and market sentiment.
- Basic patterns include Doji, Hammer, and Engulfing patterns.
- Advanced patterns like Morning Star and Three Black Crows provide deeper market insights.
- Combine candlestick analysis with other technical indicators for comprehensive trading strategies.
- Understanding market psychology is crucial for effective candlestick pattern interpretation.
- Backtesting and paper trading are essential steps before risking real money on pattern-based strategies.
- Candlestick patterns can be integrated into algorithmic trading systems.
- The future of candlestick analysis involves AI, big data, and advanced visualisation techniques.
Introduction to Candlestick Charts
Yes, it sounds very strange to learn about candlesticks when it comes to investing. However, you should consider these charts a metaphorical crystal ball. Candlestick charts have been around since the 18th century. But in reality, they have nothing to do with scented candles.
i/nstead, they tell you a lot about an asset or stock in one easy-to-read place. To break it down, it is a visual representation of changes in the market and the prices of stocks. The good news is that they’re easy to read and you can get a lot from just one quick look.
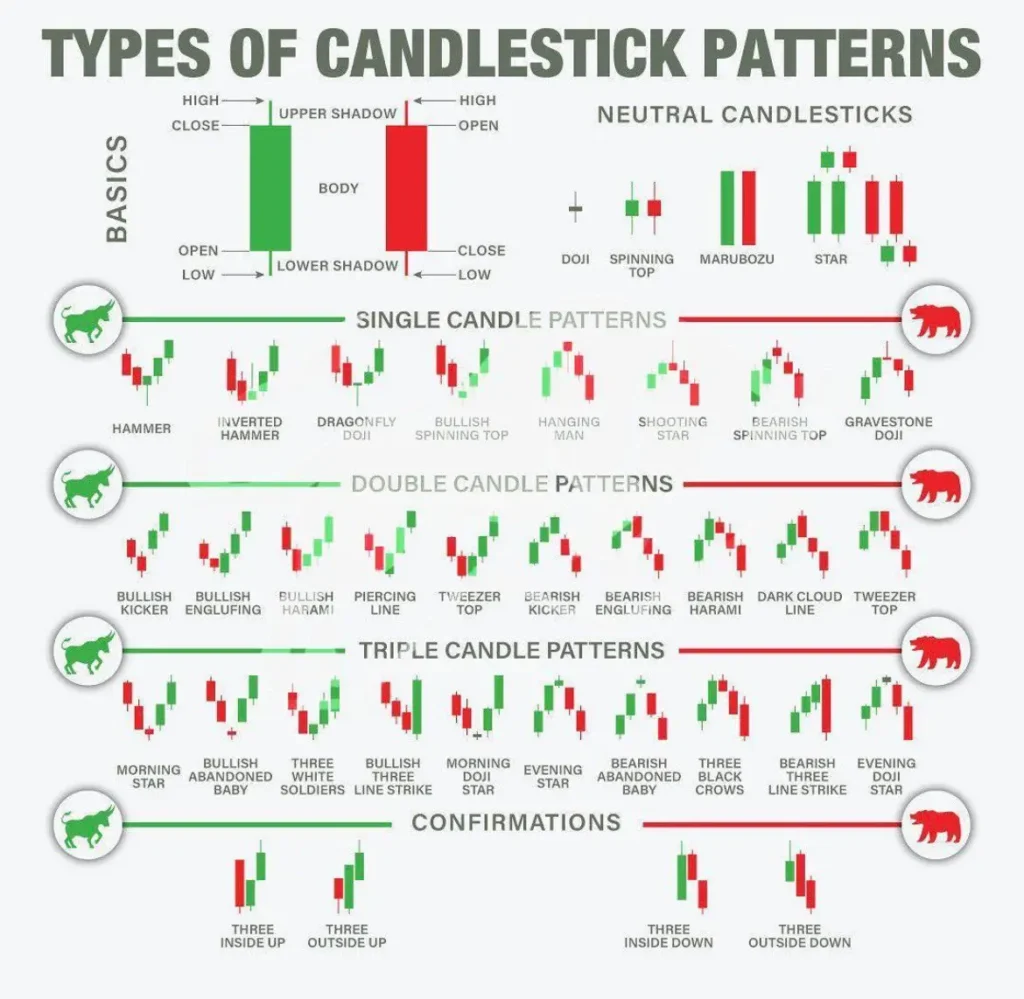
Each chart has four main values: OHLC:
- O – Opening
- H – High
- L – Low
- C – Closing
These values show you changes over a period of time. When they’re shown in a dark colour (red candlestick or black), they show a decrease in price. And when they’re shown in a light colour (green candlestick or white) they show an increase in price. You’ll also see tails or ‘wicks’ above and below the body and these show the highest and lowest points that day.
When you look at these four components together, they indicate shifts in market trends. They can also show you prospective moves, but you need to check these again the following day.
To simplify candlestick charting, a bright candle shows that the day was best for buyers. A dark candle shows that the day was ideal for sellers.
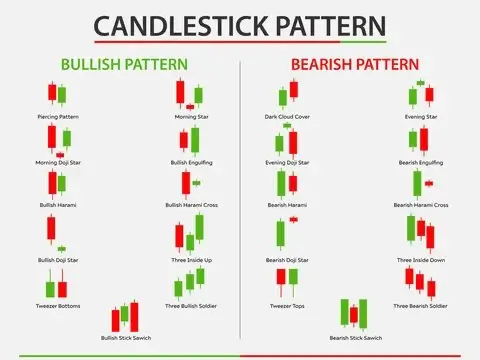
Different types of candlestick patterns indicate market conditions.
Basic Candlestick Patterns
Now let’s look at some basic candlestick patterns. After all, you need to be able to understand patterns to read the candle. Single candlestick patterns are the easiest to start with, and then you can graduate to double candlestick patterns.
Learning about the different types of candlestick patterns is a worthwhile activity. Once you can read a chart and understand it fully, your trades will be a whole lot more accurate. In fact, read our Zengo Wallet review, which provides information on a broker where you can apply your new candlestick knowledge.
Single Candlestick Patterns
Let’s start with single candlestick patterns. As the name suggests, these work alone. They give a snapshot of the market’s mood in a single trading period.
Doji
A Doji pattern stands out very clearly, and you could call it the “Switzerland” of candlestick patterns. That’s because it takes no size. It’s neutral, and tells you that it could go either way.
The pattern itself has a small body and a very long shadow attached to it. When you see this, it means you need to tread carefully. That’s because as much as it could mean something positive, it could also mean a reversal in value.
The best advice here is to let the Doji pass and allow the market to stabilise. In the meantime, you can look at other investments. In fact, eToro allows you to use their Copy Trader feature, to give you some food for thought. You can check out our eToro review for more information.
Hammer and Inverted Hammer
The Hammer is one of the most common patterns you’ll see. You’ll instantly recognise it because its shape literally looks like a hammer. It has a small body at the top and a long lower wick. This candlestick pattern is usually found at the bottom of a downward trend in the market you have your eye on. It informs you that buying pressures have made the stock or asset price rise again. The colour is usually green, and it means the market is strong. Therefore, this is a bullish candlestick pattern.
An Inverted Hammer looks exactly like an upside down hammer – the upper wick is long and the lower one is short. This pattern tells you that there was buying pressure in the market and then selling pressure. However, it wasn’t strong enough to alter the price. Yet, an Inverted Hammer signals that buyers will soon have control. So, for now, keep your eye on that potential investment.
Shooting Star
The Shooting Star usually appears at the top of upward trends and it can often show that a bullish market is about to decline. Appearance-wise, it has a small body at the bottom and a very long upper wick.
This is a bearish candlestick pattern. Therefore, if you see it, it’s a sign to take some of your profits off the table.
Double Candlestick Patterns
Next, we have double candlestick patterns, and this is where you can read a whole lot more. These patterns tell us about the mood swings in the market, with Harami and Engulfing patterns two the most common.
Engulfing Patterns
If you see an Engulfing pattern, it’s the market telling you that there’s about to be a twist in the plot. You’ll see this when one candle totally engulfs the body of the previous one. These can be both bullish and bearish patterns, depending on the circumstances.
These are shown as bars on a chart, and one will be higher than the other – engulfing it.
When a green candle engulfs the red one, it’s a bullish move. However, when a red candle swallows up a green one, it’s a bearish pattern. It’s important to remember that these candles can also show a potential reversal, so move carefully.
Harami
Next, we have the Harami pattern. This shows as a small body candle completely contained within the body of a larger one. The name actually comes from the Japanese word for “pregnant”, which sums up the shape pretty well.
A bullish Harami could suggest that the bears are slowly in decline. However, a bearish Harami shows the opposite: the bulls might be slowing down.
Overall, a Harami is a sign that the current market trend might be about to plateau for a rest.
Advanced Candlestick Patterns
Now you know the basic candlestick patterns, let’s take it up a notch and look at advanced candlestick patterns. These give you a whole lot more information and help you make stronger (and potentially more profitable) decisions.
Our AVA Trade review is a great place to learn more about a broker where you can apply strong candlestick patterns.
Triple Candlestick Patterns
A triple candlestick pattern consists of three consecutive candles that all work together to show potential trend reversals or continuations. There are several types of triple candlestick patterns: Morning Star, Evening Star, Three White Soldiers, and Three black Crows.
The good news is that if you can master these patterns, they can be very reliable compared to simpler versions.
Morning Star and Evening Star
The Morning Star candlestick pattern is the opposite to the Evening Star. Basically, they’re yin and yang.
The Morning Star appears at the end of a downward trend, giving some hope to the bulls. It signals a strong bullish reversal about to happen after a slump. A ray of light, if you will. It shows as a long bearish candle, followed by a Doji candle, and then a bullish candle at the end.
The first part of the candle shows that a downward trend is still happening. The Doji candle shows that there is still some uncertainty. However, the third part shows that a reversal will happen, and the bulls will come good again.
The Evening Star is the less positive twin. It appears at the end of an upward trend, and looks like an inversion of the Morning Star. The three patterns show a small body candle that sits in the middle of a long green and long red one. Overall, the Evening Star is a bearish reversal pattern and signals caution.
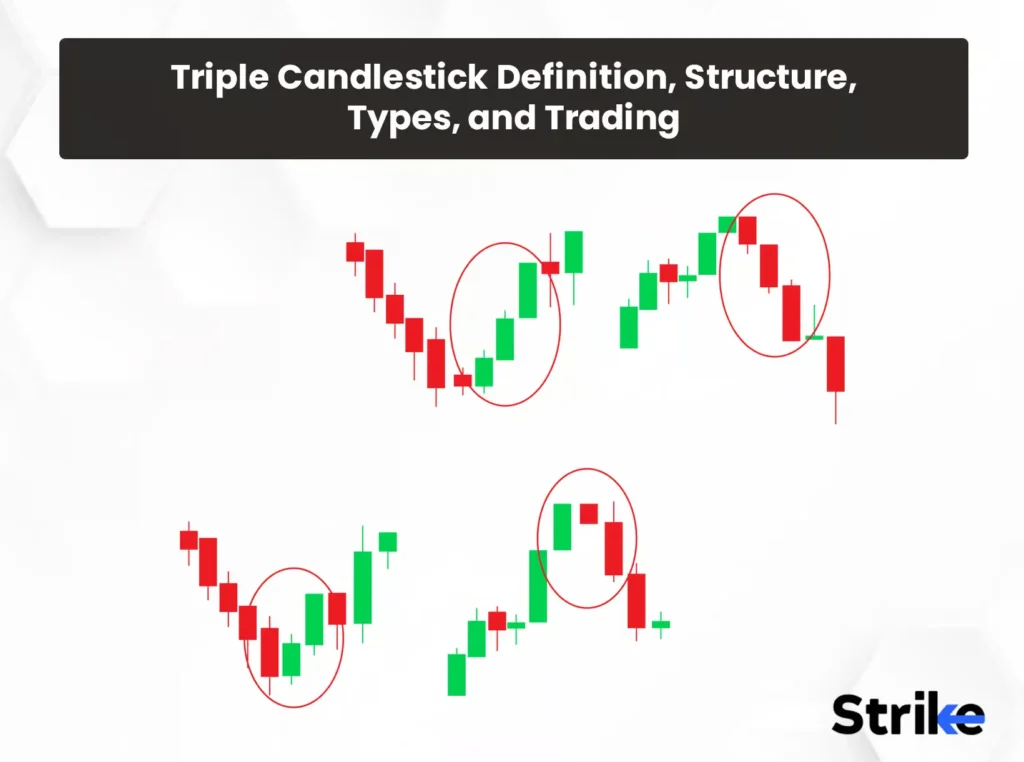
Triple candlestick patterns give a lot of information about the mood of the market.
Three White Soldiers and Three Black Crows
Let’s start with Three White Soldiers. This is a bullish pattern that signals an upcoming turnaround. It often appears at the end of a decline and shows some hope for investors. Appearance-wise it shows as three long-bodied green candles in succession. Each opens within the previous ones’ body and closes near its high.
On the other hand, the Three Black Crows is a pretty ominous sign. This is a bearish pattern. It shows three red candles, each opening in the same place as the one before. However, you’ll see that each candle goes much lower with each close.
Multi-Candle Patterns
If you have four or more candles, you’re looking at a multi-candle pattern. These give a lot of detail about the mood of the market. You won’t see these candlestick formations quite as often as the others, but you should pay attention if they appear.
Bullish and Bearish Abandoned Baby
It’s rare to see a Bullish Abandoned Baby pattern but it’s an important sign. It shows as three consecutive candles. The first is a strong down candle, a Doji that’s going downward, and a bullish upward candle at the end. This candlestick pattern shows at the bottom of downward trends and signals a potential resurge.
The Bearish Abandoned Baby is the opposite. This pattern shows at the top of uptrends, so it signals a potential drop about to happen. It looks exactly the opposite of a Bullish Abandoned Baby.
Rising and Falling Three Methods
Both of these methods show several candles and signal a brief pause in a trend. The names give away a lot of the meaning. The Rising Three Methods pattern shows that the trend is likely to go upward. However, a Falling Three Method pattern shows that it’s likely to drop.
The Rising Three Methods pattern looks like three bearish candles with a long bullish one at the end. As you can guess, the Falling Three Method looks the opposite.
Candlestick Pattern Analysis Techniques
Okay, you know the most common candlestick patterns, but now you need to know how to analyse them. After all, it’s about more than spotting shapes; you need to decipher the message the pattern is giving you.
The faster you spot these patterns, the quicker you can make decisions about your investments. This is the same advice no matter what platform you’re using, be it Pepperstone or any other. If that catches your eye, check out our Pepperstone review for more in depth knowledge.
Incidentally, research from IncredibleCharts.com shows one of the strongest bearish reversal pattern is the Three Black Crows. It has a success rate of over 60% in indicating a trend change. But that doesn’t mean you should rely upon it without careful analysis.
Along the way, there are some common phrases you might hear when you’re working with candlestick patterns:
- Open: This refers to the opening price of a candlestick and its initial value.
- Close: Refers to the closing price of the candlestick pattern you looked at initially.
- Emerging Patterns: Charts or patterns that haven’t formed yet but are in the process of doing so. Keep an eye on these.
- Completed Patterns: Patterns or charts that have developed. They show bullish or bearish signals of what is likely to happen. These are useful because they give you plenty of pertinent information.
- High: This shows the highest point of the candlestick’s price.
- Low: Opposite to the high, this shows the lowest point of the candlestick’s price.
However, to conduct candlestick chart analysis effectively, you also need to learn about context, trend, and volume. So, let’s jump in:
Context and Trend Analysis
When reading candlestick patterns, context is vital. You can’t read a candle without some background information.
For instance, if you see a Hammer pattern, you might think it’s a great development. But if it’s at the bottom downtrend, it’s not the best news. So, you need to look at the trend as a whole. Can you see any support or resistance levels to take into account? These are elements which either help or hinder the pattern.
You can look for trend lines and channels to help you here. Trend lines can be supportive or resistant, depending on whether the trend itself is going up or down. Channels are formed by trend lines in parallel, showing the price within a range. They show a consistent trend upward or downward.
Volume Analysis
Then you need to look at volume confirmation when reading candlestick patterns, along with volume divergence.
Volume tells you whether price moves are lively or not. If you have little volume confirmation, the market isn’t particularly booming; it’s lacking life. That shows you that the market isn’t really moving.
You also need to understand volume divergence, which shows that the price of stock is going in one direction, but the trading volume is going in the other. It can signal the need for caution, depending on the direction.
Understanding candlestick patterns takes time and effort.
Integrating Candlestick Patterns with Other Technical Tools
You want to do your best to make your trades successful, right? That means you need to add a few more tools to your collection. Trading candlestick patterns are ideal, but they’re best optimised with other things. That way, you can get an even clearer view of what’s happening in the market.
On top of this, you should also remember about securing your personal information when trading. As you can see, there’s far more to trading than meets the eye! Password protection is one area you need to focus on, but also consider using a VPN for extra security.
Moving Averages
A useful tool to help you read the market is moving averages. These help you see more clearly by smoothie gout price action and showing trends. Combining this with candlestick patterns gives you a stronger outlook. A moving average helps you cut out any small fluctuations in price, giving a clearer picture.
Within this, there are two types of moving averages: simple moving averages and exponential moving averages. Simple moving averages are simple calculations of the average price over a set period of time. However, exponential moving averages focus on recent prices.
Oscillators
To help you get a better idea of the mood of the market, you can use oscillators. These judge momentum in upper and lower bands. When values reach these particular bands they give you information about overbought or oversold investments.
Popular oscillators include Stochastic, MACD, and RSI.
Fibonacci Retracements
To help measure support and resistance levels, therefore helping you read candlestick patterns more effectively, you can use Fibonacci retracements. This method helps you identify where prices might reverse or bounce. The most commonly used levels are 38.2%, 50%, and 61.8%, showing bullish and bearish predictions.
When used with candlestick patterns, they give you a good idea of what is likely to happen. However, remember that this is only an indicator and certainly isn’t infallible.
Candlestick Patterns in Different Markets
When you choose to trade, there are many different tradable instruments. These vary from platform to platform, such as AVA Trade and Zengo Wallet. Choosing which instruments you want to use, such as forex, stocks, or cryptocurrencies, is an important first step. However, you then need to know that candlestick patterns can be used in different markets, to give you varied information.
Let’s explore this in more detail in the sections below:
Forex Markets
Trading in Forex is one of the most popular options and it’s an action-packed deal. Trades are made 24/7 and with so much activity, candlestick patterns are ideal for helping you understand market sentiment. However, fast-moving economic news can also mean very difficult-to-read formations too, with a lot going on. For that reason, using advanced techniques and candlestick charts can help you get a better read.
Stock Markets
Mood is very important when dealing with the stock market. It goes up and down more times than a yo-yo. Candlestick chart patterns can easily be influenced by tweets from CEOs, earnings reports, and various other factors. It’s important to be cautious when using candlestick charts in the stock market. Past performance doesn’t always guarantee future results, which is why these charts need extra analysis.
Cryptocurrency Markets
If you trade in cryptocurrency, perhaps via PocketOption or another platform, you’ll know how wild the ride can be! This is a volatile market and as it’s open 24/7, there’s a lot of activity. Candlestick patterns can easily give old information as they change so quickly. For that reason, you’ll see a lot of Doji patterns in cryptocurrency, perhaps then quickly followed by a long candle.
When using candlestick charts with cryptocurrency, speed and using other strategies alongside are key. For more information about PocketOption as a broker you can use these patterns with, check out our review.
Common Mistakes and Pitfalls in Candlestick Pattern Trading
When using candlestick patterns for the first few times, it’s easy to make a wrong move. Taking your time and learning carefully is the best option. However, understanding the common pitfalls is also a useful route forward. Frequent mistakes include poor risk management, relying too much on patterns, as well as ignoring context.
Remember that candlestick patterns give a lot of information but they’re supposed to be a guide. Even the best candlestick pattern is only a guide that you can use to make decisions. Yet, when you look at context and use other techniques, you can side-step major issues.
Advanced Candlestick Charting Techniques
We’re going to get even more advanced now. Let’s take a look at some in depth techniques that can help you make the most of candlestick patterns.
One strategy is Multiple Time Frame Analysis. This involves keeping a close eye on the same currency pair over different periods of time. Doing so gives you an idea of fluctuations and different candlestick patterns, helping you make stronger decisions.
Additionally, Pattern Frequency Analysis is another option. This allows you to identify commonly repeated patterns within the same group. Alternatively, Candlestick Pattern Scanners are specific programs that are used to identify patterns over time.
It’s interesting to note the results of a study by Morpher.com. This found that candlestick patterns and advanced analytical models used together can boost market prediction accuracy by up to 25%.

Analytical tools give you important information on good and bad trading opportunities.
Advanced Candlestick Pattern Combinations
We’re almost at the end of our series of strategies you can use to boost your investment gains. So, before we go, let’s talk about multi-candle formations to give you an even bigger chance of success.
Pattern Clusters
In candlestick analysis, pattern clusters are a useful tool. These are several patterns uniting together to give you a clearer picture. Such clusters happen when several candlestick patterns form in close proximity, therefore reinforcing signals from each.
Of course, it’s important to know that sometimes these patterns can contradict each other. To overcome that, look for confluence, when multiple patterns all point in the same direction. That’s the confirmation you need.
A good example is spotting a Morning Star at a key support level. Then, the RSI shows oversold conditions and you spot volume spiking on the third candle. That’s confluence and you should take that as a signal to make a move.
Candlestick Patterns with Chart Patterns
When you combine candlestick patterns with traditional chart patterns, you can often get great results. A good example is a head and shoulders pattern, when the right shoulder forms a shooting star.
Using candlestick charts to confirm head and shoulder patterns gives you extra information and confidence. Patterns at the head and shoulders also give signs toward powerful reversal. However, if you see a bearish engulfing pattern or a shooting star at the top of the right shoulder, that’s extra information.
Triangle Breakouts with Candlestick Confirmation
If you spot a triangle breakout with candlestick confirmation, that’s a definite thumbs up from the market. Triangles are useful regardless, because they show a tight battle between bears and bulls. It’s a good idea to look for strong bullish candles that break above the upper trending line and create a triangle. Alternatively, bearish candles that smash through support are another positive sign.
Yet, false breakouts can be a problem. That’s where you need to look for context to confirm your findings.
The Future of Candlestick Pattern Analysis
Learning about candlestick patterns might appear confusing at first, but it’s extremely useful and even fun. But it’s just as interesting to learn about the future of candlestick pattern analysis too.
AI is likely to play a strong role in candlestick pattern analysis as time goes on. This form of technology can spot patterns faster than you can blink. Virtual reality charts allow you to walk through price action in real-time, and big data analysis allows for backtesting. This is important because it means you’re more confident in your moves.
It’s easy to assume that candlestick pattern analysis is going to end up completely automated, but it’s unlikely. Remember, markets are driven by human emotion and these are things which AI can’t totally understand or grasp. At least not yet.
Of course, staying open to technological tools is important, as well as learning more about upcoming trends as they appear.
Learning Recap
We’ve certainly covered a lot of ground in our guide to candlestick patterns. It can be confusing at first, but ultimately, candlestick charts are an analytical tool that will help you beyond measure.
We’ve talked about what candlestick patterns are, why they’re useful, and the common types, including single and double patterns. You won’t be able to spot these right off the bat, but with practice, you’ll become more confident.
We’ve also covered how combining pattern recognition with other analytical tools boosts your chances of success. It’s important to remember that we live in a digital age, and that means there are many ways to automate this process. AI and other digital tools look set to take centre stage as time goes on, but they’re unlikely to take over completely.
All-in-all, candlestick patterns are powerful tools, but remember that they’re not crystal balls. The information they give you should be checked alongside context and the border market. When you combine this information with other tools, you get a more accurate picture.
Finally, risk management is crucial in trading, whether you use candlestick patterns or not. Analytical tools can always fail, so remember to keep your capital safe and protect it at all costs. Yet, with continuous learning, you’ll be able to spot troublesome situations and you’ll know what to avoid.
Final Thoughts
Using candlestick patterns in your trading journey adds to its accuracy and excitement. Delving further into how to make your investments more profitable is not only interesting but could give you even bigger yields. As we’ve mentioned, candlestick patterns are great tools, but they’re not guaranteed. For that reason, continued learning and responsible trading practices are key.
At Privacy Australia, we know how confusing the whole trading world can be at first glance. Even for an experienced trader, there will be times when you second-guess yourself. That’s where knowledge and learning comes to the forefront.
We have a whole host of useful articles and guides you can delve into. From the best brokers to how to protect yourself while trading with VPNs we’ve reviewed, our research can help you have a safer experience.
By focusing on careful moves and understanding the market, you’ll get so much more from your trading endeavours. We are with you every step of the way.
You Might Also Like:
- 10 Chart Patterns Every Trader Must Know in 2024
- CFDs Vs Stocks
- Best Long Term Investments (2024: Australia – An Honest Guide)